One of the most important aspects of volume shading is the choice of a transfer function. This function assigns a color and opacity to every input value. It is the shader's job to define such a transfer function. In order to do this, both shaders use an intensity mapping. While the way color is determined differs for smoke and fire, in both shaders the intensity mapping is basically the black-and-white version of the transfer function.
TurbulenceFD features a special purpose function curve (f-curve) editor that allows for convenient and accurate control of the transfer function by the artist. Working with this editor is very similar to post-processing images with color correction. If you have any experience in that area, this will be familiar to you.
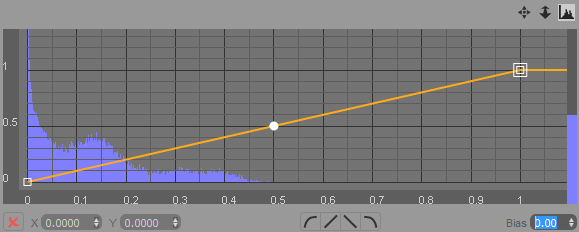
A linear mapping, as shown in the image above, makes color and opacity scale proportional to the input values. In many cases we want to cut off some parts or amplify others, though.
For example, for smoke shading we might want to have a smaller range of thickness (or opacity) that the smoke can take on. That is, the thickness should not fall off linearly with the density, but sustain a high value and then fall of quickly and the low end of the density range as shown in the image below.
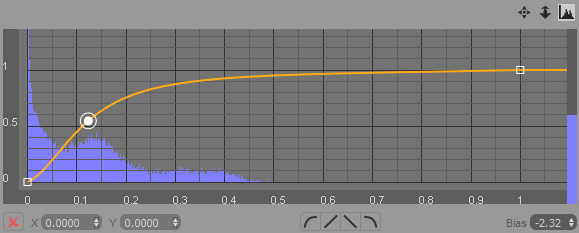
To assist with the design of the mapping function, the editor shows a histogram of the input values as a backdrop. For example, in the image above we can see that there are no input values above 0.5, so we should focus our mapping function on the values that are actually in the container. Of course, the value distribution will change from frame to frame depending on your simulation, so you will have to look at the histogram as it changes over time and design a mapping function accordingly or even animate it. 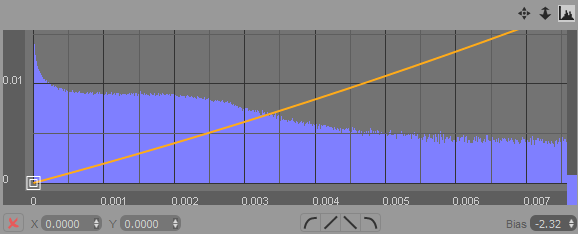
Often it is necessary to create very subtle changes to the mapping function to obtain a certain look. Note the value ranges on the X and Y axes in the image above. The editor has been zoomed in to show the fine details at the low end of the input value range. The histogram shows us that there are still significant changes at this scale and by increasing the intensity for this range (about 0.001 to 0.004) we will get a big visual difference.
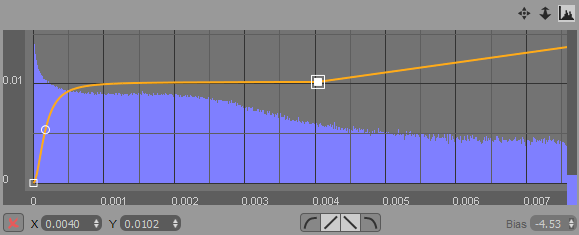
For fire shading, we usually want only a narrow band around the surface of the flame to be visible and luminous. We can do this by defining a small peak in the fire shader's opacity mapping as shown in the image below.
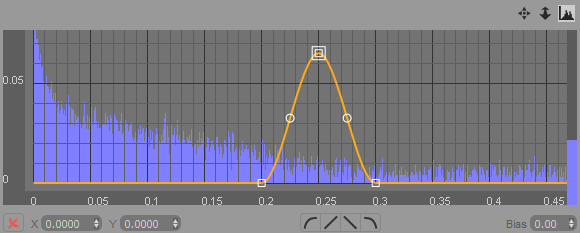
With different f-curve designs, we can achieve a wide range of looks. Make smoke contours sharper by suppressing low density values, fill the inside of a flame by extending the above peak to the right, etc.
The following image shows the various controls of the editor:
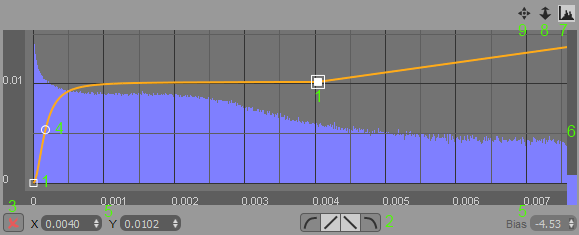
select and drag knots (1) using the left mouse button
add new knots using the right button
select multiple knots by holding down shift while left-clicking and dragging the mouse to span a selection-rectangle
move selected knots (1) by left-clicking on any of them and dragging them to their new position
define smooth or linear tangents for the knots using the tangent buttons (2)
delete selected knots by pressing the delete button on the toolbar (3) or the delete key
bend a curve segment (change the bias) by left-clicking a segment handle (4) and moving the mouse horizontally
change all these values using the value input boxes (5)
adjust the scale of the histogram using the blue slider on the right (6)
toggle the histogram on and off using the histogram button (7)
use the mouse wheel or zoom button (8) to zoom horizontally or vertically when holding Shift at the same time
use the middle mouse button or the translate button (9) to translate the view